20141026 – Steering what exactly ?
So far I have been muttering about how we steer, but we also need to talk about what we steer.
As I mentioned previously, computers have much better timebases today than they had when Electric Light Orchestra released their album “Time”, but how much better exactly and are there any of the usual footnotes ?
I decided to measure it today.
Most motherboards have a 14.318 MHz crystal as master timebase, and derive any other clocks needed from that with PLLs.
(There’s an interesting story behind 14.318 MHz, the really short version is that the IBM PC was designed to compete with the Commodore 64, and therefore needed to be able to use a (NTSC) color TV. 14.318 MHz is four times the NTSC color subcarrier, making it easy for the PC to display four ghastly colors. The NTSC color subcarrier is 227.5/286 of 4.5 MHz, which is another interesting story, but you can google that yourself.)
PC’s still support the “beep-speaker” from the original IBM PC, driven from a i8253 counter/timer device clocked by 1/12th of the 14.318 MHz, which gives us a neat way to measure the frequency of the clock crystal directly.
I programmed the i8253 to emit as close to 100Hz as possible (timer word: 0x2e9b), and used my HP5370B to measure the phase relationship between this signal, and a 100Hz derived from my GPSDO labstandard.
Here is a plot of the phase:
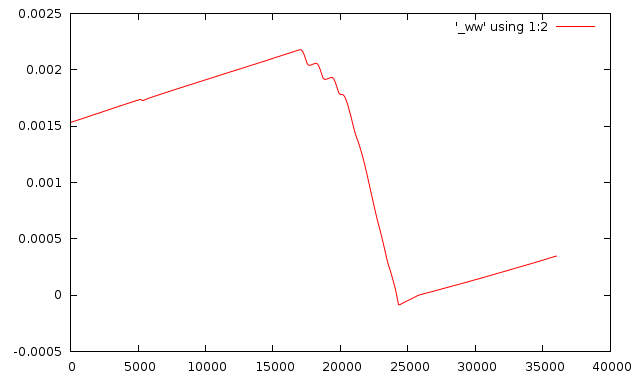
If you think that looks weird, wait until you see the frequency:

The reason most crystals don’t behave that way, is that people usually don’t put a 100W variable heating element right next to them.
If you look at the horizontal part, you can see a lot of small wiggles, that is the aircondition cycling on and off.
Around 5000 seconds, there’s a dip, that’s me using the machine to crunsh a couple of gigabytes of data, and the heat from the CPU affects the crystal.
Later I decided to provoke this, and the result is the sequence of CPU heavy stuff running from appox 15k to 25k seconds.
This load dependency of computer clocks is not new, I documented the exact same issue two decades ago when I developed the “timecounters” and the “NTP nanokernel”.
Here is a modified Allan variance view of things:
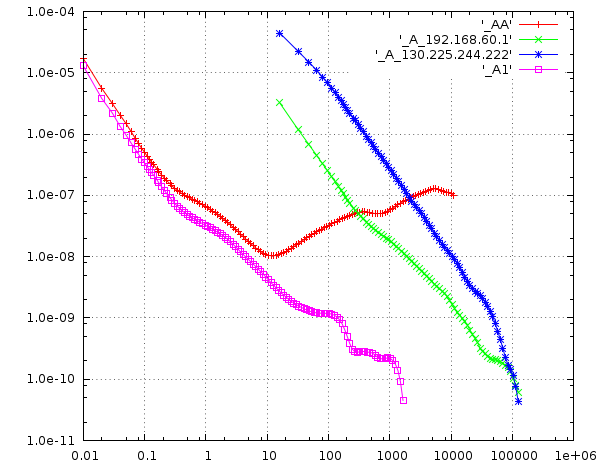
The red AA trace is the data from above. The purple A1 trace is the initial subset of the same data, ending before I started taxing the CPU.
The green trace are unfiltered packet exchanges with a on-site NTP server, the blue trace similar, but for a off-site NTP server.
Strictly speaking, the (modified) Allan variance is not suitable for data which suffer from odd-ball noise processes like CPU heating, but it does give an indication of the parameter space for our PLL.
If I had let things run long for a week, eventually the purple would cross the green and blue traces, and in theory we would have fenced in the working area for our PLL, for this particular machine, but already now we can see that it covers a couple of orders of magnitude in both directions.
More importantly however, is that this plot doesn’t say anything about phase errors at all, and phase is what people running NTP clients care about, they’re not really interested in frequency.
phk